|
WebSurfer さん
ありがとうございます。
確かにこの方法ならできそうな気がしましたので
試してみました。
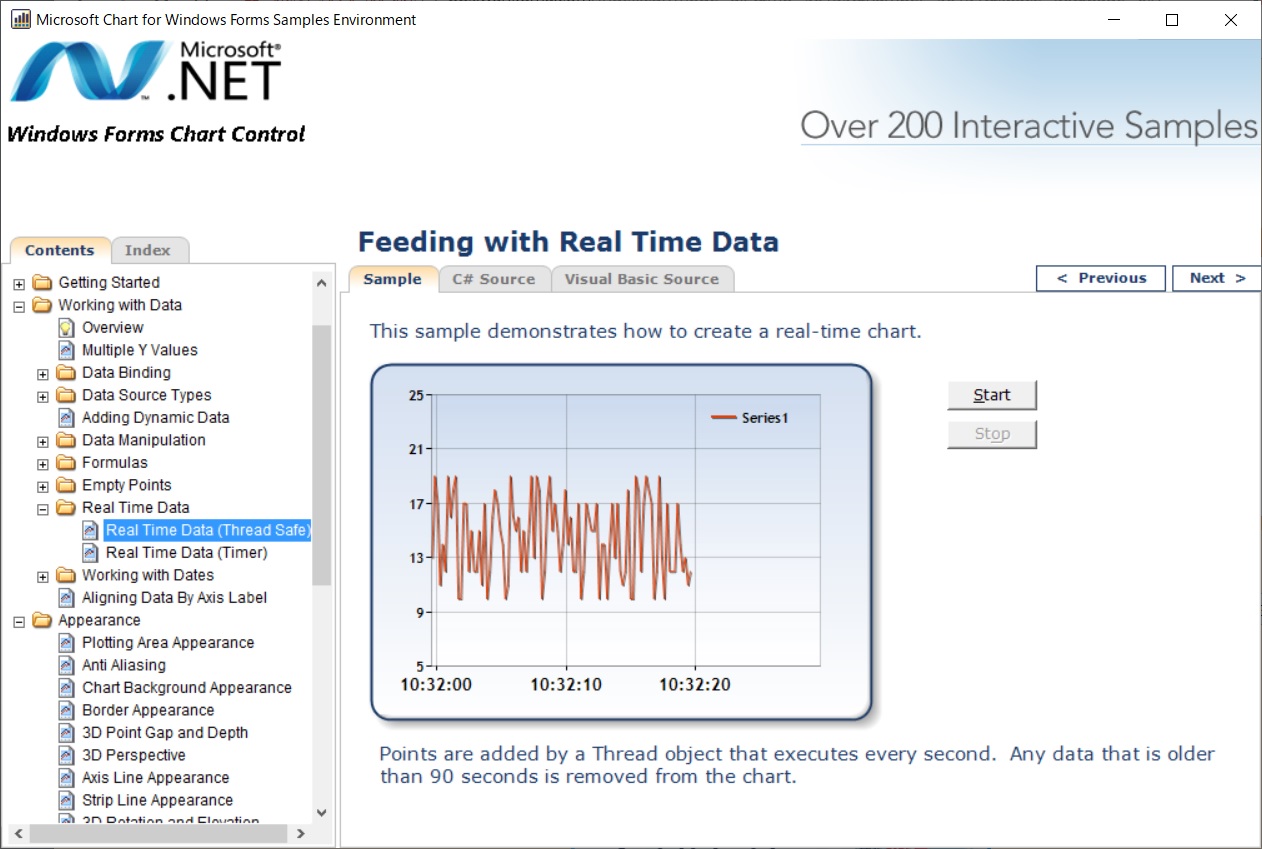
まず、C#のものをそのままビルドして試してみたのですが
fileIn = new StreamReader(fileName);
というところで以下のエラーが出てしまい実行できませんでした。
型 'System.IO.FileNotFoundException' のハンドルされていない例外が mscorlib.dll で発生しました
追加情報:ファイル 'D:¥desktop¥Windows Forms Samples Environment for Microsoft Chart Controls¥cs_langDef.xml' が見つかりませんでした。
仕方なく、VBのコードを少し改良したところ、うまくビルドできました。
ただし、ResumeとSuspendのところで警告メッセージが出てしまいます。
警告 BC40000 'Public Overloads Sub [Resume]()' は廃止されています: 'Thread.Resume has been deprecated. Please use other classes in System.Threading, such as Monitor, Mutex, Event, and Semaphore, to synchronize Threads or protect resources. http://go.microsoft.com/fwlink/?linkid=14202'。
警告 BC40000 'Public Overloads Sub Suspend()' は廃止されています: 'Thread.Suspend has been deprecated. Please use other classes in System.Threading, such as Monitor, Mutex, Event, and Semaphore, to synchronize Threads or protect resources. http://go.microsoft.com/fwlink/?linkid=14202'。
どうも、これらのコードの使用をいまのVSが推奨していないようです。
一体、どのように書き換えたら良いでしょうか?
Public Class Form1
Private addDataRunner As Thread
Private rand As New Random()
' Private chart3 As System.Windows.Forms.DataVisualization.Charting.Chart
Public Delegate Sub AddDataDelegate()
Public addDataDel As AddDataDelegate
Private minValue, maxValue As DateTime
Private Sub Form1_Load(sender As Object, e As EventArgs) Handles MyBase.Load
Dim addDataThreadStart As New ThreadStart(AddressOf AddDataThreadLoop)
addDataRunner = New Thread(addDataThreadStart)
addDataDel = New AddDataDelegate(AddressOf AddData)
End Sub 'RealTimeSample_Load
Private Sub startTrending_Click(sender As Object, e As System.EventArgs) Handles startTrending.Click
' Disable all controls on the form
startTrending.Enabled = False
' and only Enable the Stop button
stopTrending.Enabled = True
' Predefine the viewing area of the chart
minValue = DateTime.Now
maxValue = minValue.AddSeconds(120)
Chart2.ChartAreas(0).AxisX.Minimum = minValue.ToOADate()
Chart2.ChartAreas(0).AxisX.Maximum = maxValue.ToOADate()
' Reset number of series in the chart.
Chart2.Series.Clear()
' create a line chart series
Dim newSeries As New Series("Series1")
newSeries.ChartType = SeriesChartType.Line
newSeries.BorderWidth = 2
newSeries.Color = Color.OrangeRed
newSeries.XValueType = ChartValueType.DateTime
Chart2.Series.Add(newSeries)
' start worker threads.
If addDataRunner.IsAlive = True Then
addDataRunner.Resume()
Else
addDataRunner.Start()
End If
End Sub 'startTrending_Click
Private Sub stopTrending_Click(sender As Object, e As System.EventArgs) Handles stopTrending.Click
If addDataRunner.IsAlive = True Then
addDataRunner.Suspend()
End If
' Enable all controls on the form
startTrending.Enabled = True
' and only Disable the Stop button
stopTrending.Enabled = False
End Sub 'stopTrending_Click
'/ Main loop for the thread that adds data to the chart.
'/ The main purpose of this function is to Invoke AddData
'/ function every 1000ms (1 second).
Private Sub AddDataThreadLoop()
While True
Chart2.Invoke(addDataDel)
Thread.Sleep(1000)
End While
End Sub 'AddDataThreadLoop
Public Sub AddData()
Dim timeStamp As DateTime = DateTime.Now
Dim ptSeries As Series
For Each ptSeries In Chart2.Series
AddNewPoint(timeStamp, ptSeries)
Next ptSeries
End Sub 'AddData
'/ The AddNewPoint function is called for each series in the chart when
'/ new points need to be added. The new point will be placed at specified
'/ X axis (Date/Time) position with a Y value in a range +/- 1 from the previous
'/ data point's Y value, and not smaller than zero.
Public Sub AddNewPoint(timeStamp As DateTime, ptSeries As System.Windows.Forms.DataVisualization.Charting.Series)
Dim newVal As Double = 0
If ptSeries.Points.Count > 0 Then
newVal = ptSeries.Points((ptSeries.Points.Count - 1)).YValues(0) + (rand.NextDouble() * 2 - 1)
End If
If newVal < 0 Then
newVal = 0
End If
' Add new data point to its series.
ptSeries.Points.AddXY(timeStamp.ToOADate(), rand.Next(10, 20))
' remove all points from the source series older than 1.5 minutes.
Dim removeBefore As Double = timeStamp.AddSeconds((CDbl(90) * -1)).ToOADate()
'remove oldest values to maintain a constant number of data points
While ptSeries.Points(0).XValue < removeBefore
ptSeries.Points.RemoveAt(0)
End While
Chart2.ChartAreas(0).AxisX.Minimum = ptSeries.Points(0).XValue
Chart2.ChartAreas(0).AxisX.Maximum = DateTime.FromOADate(ptSeries.Points(0).XValue).AddMinutes(2).ToOADate()
Chart2.Invalidate()
End Sub 'AddNewPoint
'/ Clean up any resources being used.
Protected Overloads Overrides Sub Dispose(ByVal disposing As Boolean)
If (addDataRunner.ThreadState And ThreadState.Suspended) = ThreadState.Suspended Then
addDataRunner.Resume()
End If
addDataRunner.Abort()
If disposing Then
If Not (components Is Nothing) Then
components.Dispose()
End If
End If
MyBase.Dispose(disposing)
End Sub 'Dispose
End Class
|